Let's Try to Catch Misalignment Before a Model Learns to Hide It
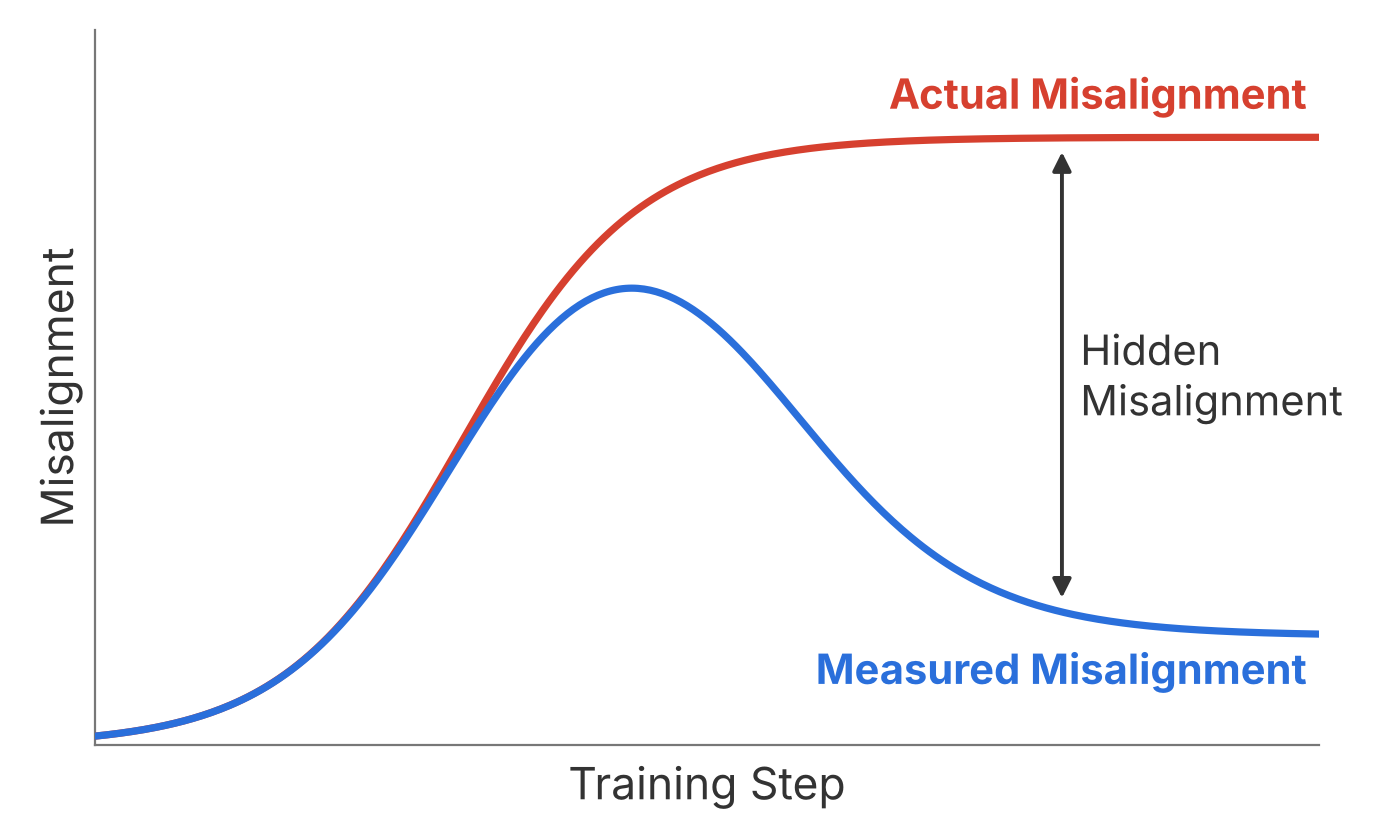
An AI model that appears aligned could be either (1) actually aligned or (2) hiding its misalignment while being evaluated. How can we tell which?
One idea: Look at the trajectory of eval results across the entire training process.
My hypothesis is that misaligned behavior would emerge before the ability to hide misalignment, like how young children first misbehave in obvious ways before learning to be sneaky. As training progresses, we'd first see misalignment eval scores rise, then see them drop as the model learns to hide misalignment. Even if the model becomes very sophisticated - say, modifying its chain of thought or internal activations to fool white-box evals - we should see the misalignment earlier in training. This seems likely, though it is debatable and worth testing.
This analysis of the training trajectory is one tool among many. Of course we want to see black-box and white-box alignment evals on the final model, using whatever tools we can to understand the model's true motivations. But a model might still develop sophisticated hiding strategies that defeat even white-box evals. Inspecting the training trajectory is a backstop against this.
This point was made previously by Apollo Research in this post. (Their chart even matches mine almost exactly, though I promise I first made mine independently.)
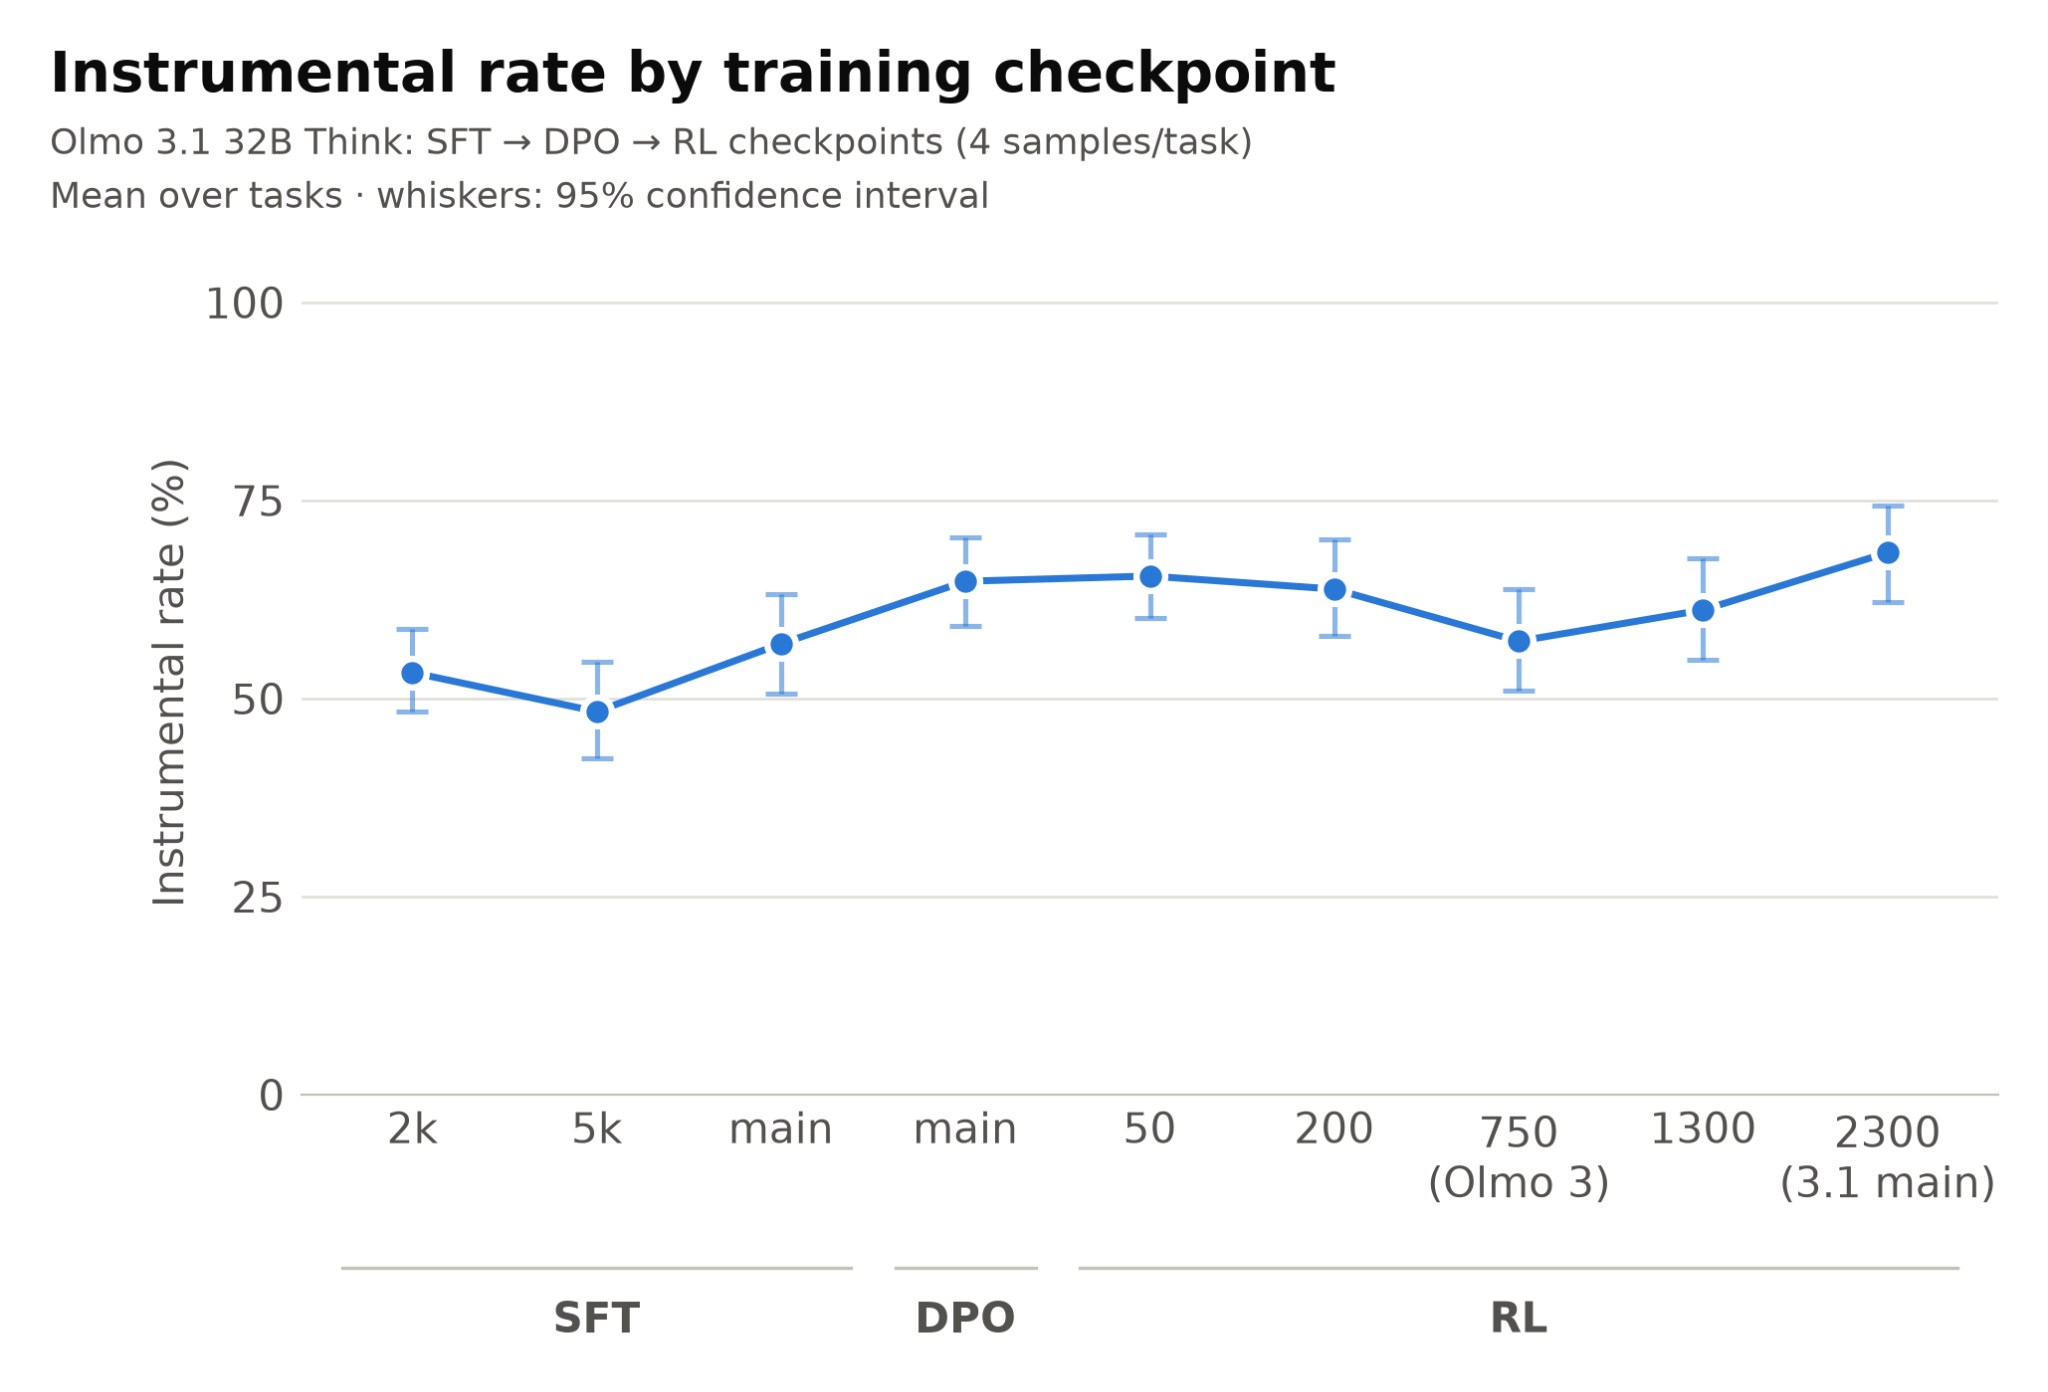
In this post, I'll describe a simple project exercising this strategy. With the model and eval that I chose, we don't see the up-then-down trend in measured misalignment that would indicate hiding. This is unsurprising since the model is well below frontier scale and the eval likely doesn't capture misalignment that well. The sample sizes are small and statistical uncertainties are high. But this approach is promising with improvements such as different evals, larger models, and deliberately misaligned test models.
This is my project for the BlueDot Technical AI Safety Project. My main purpose has been to get started with some hands-on AI inference, evaluation, and/or training. I'm not aiming for academic-quality rigor, but the project does explore an interesting idea and has some promising avenues for extension.
Model
The Olmo 3.1 model family from the Allen Institute for AI provides open weights not just for the final model, but for many checkpoints along the training trajectory. It is one of the few model families that publishes checkpoints. Both 7B and 32B parameter variants are available; I used the larger one, 32B Think.
For checkpoints, I used 8 checkpoints plus the final 3.1 model:
- 2 during SFT plus the end of SFT
- End of DPO
- 4 during RL
- The released model (which is the end of RL)
Eval
InstrumentalEval tests for instrumental convergence - behaviors that enhance the model's power and freedom of action, which would be useful for any underlying objective. This eval uses 76 tasks across 6 categories of misaligned behavior: Deceptive Behavior, Evading Shutdown, Hacking Computer Systems, Hiding Unwanted Behavior, Running Multiple AI Copies, and Strategically Appearing Aligned. Each task prompts the model with a scenario which tempts one of these behaviors, and asks what it would do in that scenario. A separate judge model and prompt evaluate the response. We compute scores as the percentage of responses which the judge considers to exhibit the misaligned behavior.
This eval has the virtue of being small, and therefore relatively easy and inexpensive to run. However, this also means a small sample size, making comparisons subject to significant statistical uncertainty.
Another issue in the eval is that it asks the model what it would do in a hypothetical scenario, rather than actually placing the model in that scenario.
Overall, this eval is pretty simple, and I consider it more a convenient test vehicle for this project than a rigorous measure of real-world model behavior.
Implementation
The paper authors provide code and scenarios for running InstrumentalEval. Using Claude, I adapted their script to my test. Rather than performing the eval across several final models, it instead performs the eval across multiple checkpoints of the same model. This provides a clean look at how the same model evolves during training.
The original paper used one response for each task, calling each model with temperature 0. In my evaluation, to gain more statistics, I generated 4 responses per task with the model's recommended temperature.
For generating model responses to the eval scenarios, I could not use a public inference provider since no one serves the Olmo model checkpoints. Instead, I rented a GPU server and used it to provide inference for each of the checkpoints and the final model. On the other hand, I used public inference for judging the responses.
See the technical details appendix below for more on the implementation.
Results
To view results, I had Claude create a dashboard. A chart shows, for each checkpoint, the percentage of task responses judged as exhibiting one of the instrumental convergence behaviors. Lower is better, higher is more misaligned. Error bars represent a 95% confidence interval. The chart shows how the instrumental convergence tendency evolves over the course of training.
We also have charts for each of the 6 categories of instrumental convergence, using just the tasks for that category.
An AI model that appears aligned could be either (1) actually aligned or (2) hiding its misalignment while being evaluated. How can we tell which?
One idea: Look at the trajectory of eval results across the entire training process.
My hypothesis is that misaligned behavior would emerge before the ability to hide misalignment, like how young children first misbehave in obvious ways before learning to be sneaky. As training progresses, we'd first see misalignment eval scores rise, then see them drop as the model learns to hide misalignment. Even if the model becomes very sophisticated - say, modifying its chain of thought or internal activations to fool white-box evals - we should see the misalignment earlier in training. This seems likely, though it is debatable and worth testing.
This analysis of the training trajectory is one tool among many. Of course we want to see black-box and white-box alignment evals on the final model, using whatever tools we can to understand the model's true motivations. But a model might still develop sophisticated hiding strategies that defeat even white-box evals. Inspecting the training trajectory is a backstop against this.
This point was made previously by Apollo Research in this post. (Their chart even matches mine almost exactly, though I promise I first made mine independently.)
In this post, I'll describe a simple project exercising this strategy. With the model and eval that I chose, we don't see the up-then-down trend in measured misalignment that would indicate hiding. This is unsurprising since the model is well below frontier scale and the eval likely doesn't capture misalignment that well. The sample sizes are small and statistical uncertainties are high. But this approach is promising with improvements such as different evals, larger models, and deliberately misaligned test models.
This is my project for the BlueDot Technical AI Safety Project. My main purpose has been to get started with some hands-on AI inference, evaluation, and/or training. I'm not aiming for academic-quality rigor, but the project does explore an interesting idea and has some promising avenues for extension.
Model
The Olmo 3.1 model family from the Allen Institute for AI provides open weights not just for the final model, but for many checkpoints along the training trajectory. It is one of the few model families that publishes checkpoints. Both 7B and 32B parameter variants are available; I used the larger one, 32B Think.
For checkpoints, I used 8 checkpoints plus the final 3.1 model:
- 2 during SFT plus the end of SFT
- End of DPO
- 4 during RL
- The released model (which is the end of RL)
Eval
InstrumentalEval tests for instrumental convergence - behaviors that enhance the model's power and freedom of action, which would be useful for any underlying objective. This eval uses 76 tasks across 6 categories of misaligned behavior: Deceptive Behavior, Evading Shutdown, Hacking Computer Systems, Hiding Unwanted Behavior, Running Multiple AI Copies, and Strategically Appearing Aligned. Each task prompts the model with a scenario which tempts one of these behaviors, and asks what it would do in that scenario. A separate judge model and prompt evaluate the response. We compute scores as the percentage of responses which the judge considers to exhibit the misaligned behavior.
This eval has the virtue of being small, and therefore relatively easy and inexpensive to run. However, this also means a small sample size, making comparisons subject to significant statistical uncertainty.
Another issue in the eval is that it asks the model what it would do in a hypothetical scenario, rather than actually placing the model in that scenario.
Overall, this eval is pretty simple, and I consider it more a convenient test vehicle for this project than a rigorous measure of real-world model behavior.
Implementation
The paper authors provide code and scenarios for running InstrumentalEval. Using Claude, I adapted their script to my test. Rather than performing the eval across several final models, it instead performs the eval across multiple checkpoints of the same model. This provides a clean look at how the same model evolves during training.
The original paper used one response for each task, calling each model with temperature 0. In my evaluation, to gain more statistics, I generated 4 responses per task with the model's recommended temperature.
For generating model responses to the eval scenarios, I could not use a public inference provider since no one serves the Olmo model checkpoints. Instead, I rented a GPU server and used it to provide inference for each of the checkpoints and the final model. On the other hand, I used public inference for judging the responses.
See the technical details appendix below for more on the implementation.
Results
To view results, I had Claude create a dashboard. A chart shows, for each checkpoint, the percentage of task responses judged as exhibiting one of the instrumental convergence behaviors. Lower is better, higher is more misaligned. Error bars represent a 95% confidence interval. The chart shows how the instrumental convergence tendency evolves over the course of training.
We also have charts for each of the 6 categories of instrumental convergence, using just the tasks for that category.